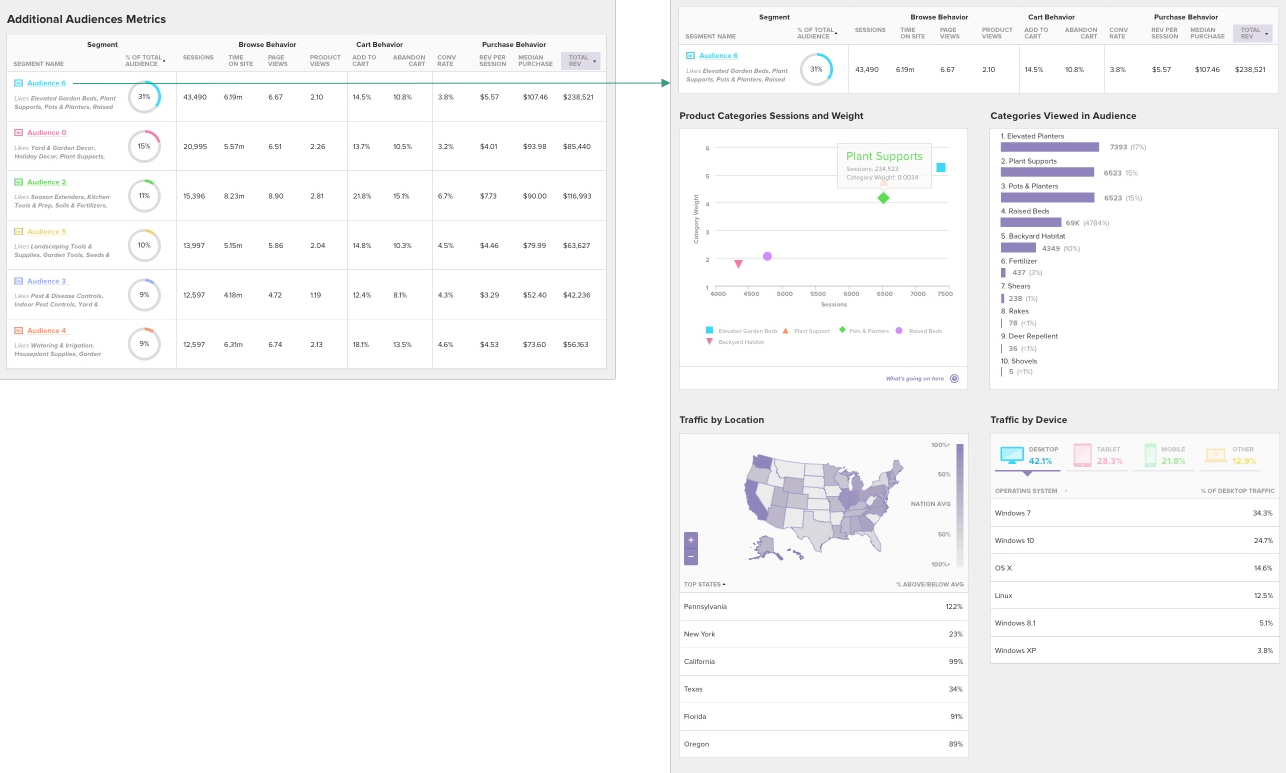
Present Meaningful Data
As the amount of big data increases, more people are using data visualization techniques to access insights on user behavior. Great data visualizations enables decision makers to view analytics, so they can grasp difficult concepts or identify new patterns.
- Data visualization
- Charts
- Graphs
- User Research

Structure Data Visualization for the End User
Data visualization changes the way analysts work with data. By using graphical representations, businesses are able to see large amounts of data significantly faster (as opposed to large spreadsheets) and can address problems or answer questions in a more timely manner.

Drilldown for More Information
Interactive visualization can take concepts a step further by allowing the user to drill down into charts and graphs for more detail.